
Research · September 4, 2026
Crowding out: AI borrowing and Treasury yields
AI borrowing is affecting hyperscaler credit pricing, while its contribution to higher Treasury yields remains limited. Expected short-term rates explain much of the modelled 2026 rise in the 10-year yield, and federal financing needs remain an important longer-term pressure.

Research
Crowding out: AI borrowing and Treasury yields
A4 PDF · 3 pages · 149 KB · 4 September 2026
Download PDFHow big is the corporate debt market
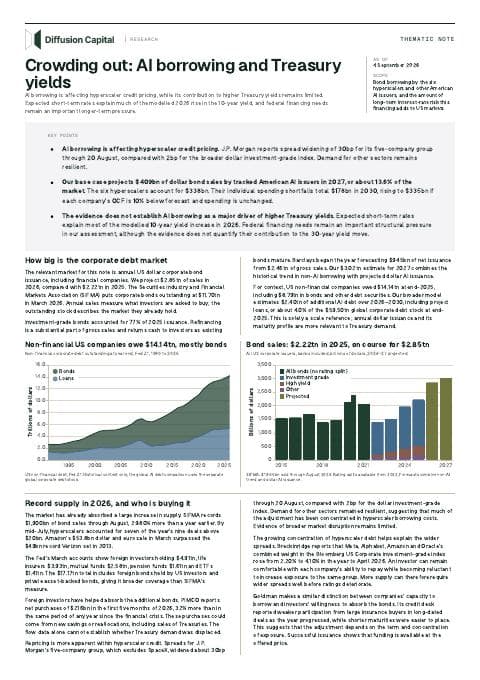
The relevant market for this note is annual US dollar corporate bond issuance, including financial companies. We project $2.85tn of sales in 2026, compared with $2.22tn in 2025. The Securities Industry and Financial Markets Association (SIFMA) puts corporate bonds outstanding at $11.70tn in March 2026. Annual sales measure what investors are asked to buy; the outstanding stock describes the market they already hold.
Investment-grade bonds accounted for 77% of 2025 issuance. Refinancing is a substantial part of gross sales and returns cash to investors as existing bonds mature. Barclays began the year forecasting $945bn of net issuance from $2.46tn of gross sales. Our $3.02tn estimate for 2027 combines the historical trend in non-AI borrowing with projected dollar AI issuance.
For context, US non-financial companies owed $14.14tn at end-2025, including $8.79tn in bonds and other debt securities. Our broader model estimates $2.40tn of additional AI debt over 2026–2030, including project loans, or about 4.0% of the $59.50tn global corporate debt stock at end-2025. This is solely a scale reference; annual dollar issuance and its maturity profile are more relevant to Treasury demand.
Non-financial US companies owe $14.14tn, mostly bonds
Non-financial corporate debt outstanding at year end, Fed Z.1, 1990 to 2025
A stacked area from 1990 to 2025 in which total debt rises from under three trillion dollars to about fourteen trillion, with bonds growing faster than loans and overtaking them in the 2010s.
US non-financial debt, Fed Z.1. Historical context only; the global AI debt comparison uses the separate global corporate debt stock.
Source: Federal Reserve Z.1 nonfinancial corporate debt stock · 2026-09-04
Bond sales: $2.22tn in 2025, on course for $2.85tn
All US corporate issuers, banks included, billions of dollars, 2026–27 projected
Stacked bars from 2015 to 2027. Sales run near one and a half trillion dollars, jump in 2020, reach two point two trillion in 2025, and the two projected bars climb to about three trillion.
SIFMA: $1,900bn sold through August 2026. Rating splits available from 2022. Forecasts combine non-AI trend and dollar AI issuance.
Source: SIFMA U.S. Corporate Bonds Statistics, September 2026 update, Goldman Sachs Exchanges - How AI Debt Is Reshaping Credit Markets · 2026-09-04
Record supply in 2026, and who is buying it
The market has already absorbed a large increase in supply. SIFMA records $1,900bn of bond sales through August, 29.80% more than a year earlier. By mid-July, hyperscalers accounted for seven of the year's nine deals above $20bn. Amazon's $53.8bn dollar and euro sale in March surpassed the $49bn record Verizon set in 2013.
The Fed's March accounts show foreign investors holding $4.91tn, life insurers $3.93tn, mutual funds $2.58tn, pension funds $1.61tn and ETFs $1.41tn. The $17.17tn total includes foreign bonds held by US investors and private asset-backed bonds, giving it broader coverage than SIFMA's measure.
Foreign investors have helped absorb the additional bonds. PIMCO reports net purchases of $216bn in the first five months of 2026, 32% more than in the same period of any year since the financial crisis. These purchases could come from new savings or reallocations, including sales of Treasuries. The flow data alone cannot establish whether Treasury demand was displaced.
Repricing is more apparent within hyperscaler credit. Spreads for J.P. Morgan's five-company group, which excludes SpaceX, widened about 30bp through 20 August, compared with 2bp for the dollar investment-grade index. Demand for other sectors remained resilient, suggesting that much of the adjustment has been concentrated in hyperscaler borrowing costs. Evidence of broader market disruption remains limited.
The growing concentration of hyperscaler debt helps explain the wider spreads. Breckinridge reports that Meta, Alphabet, Amazon and Oracle's combined weight in the Bloomberg US Corporate investment-grade index rose from 2.20% to 4.10% in the year to April 2026. An investor can remain comfortable with each company's ability to repay while becoming reluctant to increase exposure to the same group. More supply can therefore require wider spreads well before ratings deteriorate.
Goldman makes a similar distinction between companies' capacity to borrow and investors' willingness to absorb the bonds. Its credit desk reported weaker participation from large insurance buyers in long-dated deals as the year progressed, while shorter maturities were easier to place. This suggests that the adjustment depends on the term and concentration of exposure. Successful issuance shows that funding is available at the offered price.
How big the AI buildout is
We track 19 companies across hyperscalers, neoclouds, semiconductor manufacturing and the rest of the AI infrastructure supply chain. Capital spending totals $8.61tn over 2026–2030 in our base case, reaching $2,193bn a year by 2030. For the same 18 companies covered in 2025, annual spending rises from $550bn to $1,946bn; SpaceX enters the total from 2026.
The analysis includes company-wide spending because all uses of cash affect financing needs. Amazon's logistics investment and SpaceX's launch programme draw on resources also available for data centres, making the estimate an upper bound for AI spending within this cohort. The six hyperscalers—Alphabet, Amazon, Meta, Microsoft, Oracle and SpaceX—account for most of the total.
19 AI companies spend $8.61tn over 2026–2030
Cash capex by group, base case, billions of dollars
Stacked bars from 2025 to 2030 rise from about five hundred billion dollars to about two trillion. Hyperscalers are the largest group, followed by semiconductor manufacturers, neoclouds and the rest of the ecosystem.
Company-wide cash capex. SpaceX is included from 2026; 2025 excludes it because only AI-segment capex is reported. Later years are modeled.
Source: Goldman Sachs Exchanges - How AI Debt Is Reshaping Credit Markets, Financial Modeling Prep analyst estimates · 2026-09-04
How much cash flow can fund
The six hyperscalers' company forecasts imply $7.25tn of capital spending and incremental fixed payments through 2030. OCF equals about 84% of that total, but companies cannot use each other's surplus cash. Calculating shortfalls separately gives $431bn in 2027 and $178bn in 2030, before cash balances, dividends and debt repayments. Across five years, these shortfalls total $1,291bn.
Completed fiscal years use reported capex and cash flow, including Microsoft and Oracle's FY2026 results. Forecasts use analysts' OCF estimates where available, or consensus EBITDA converted using historical cash conversion. Annual OCF rises from $836bn to $1,717bn between 2026 and 2030, an increase of 105%. This requires sustained AI adoption and usage; analyst coverage is thinner in the later years.
In 2030 the six still spend $161bn more than they generate in aggregate, and the shortfalls above sit with individual borrowers. If each company's OCF is 10% below forecast, their shortfalls rise to $335bn. Cash reserves or delayed projects could reduce borrowing, although signed contracts restrict flexibility. Ordinary operating payments are assumed embedded in OCF and are not deducted again.
The five cloud parents' operating cash flow covers about 72% of their 2027 spending. The shortfall is $340bn before distributions and $417bn once $49bn of dividends and $29bn of maturing bonds are added. Running cash balances down to our minimum reserve would reduce the outside funding need to $317bn, so the cash cushion is worth about $101bn. Goldman's $400bn bond forecast therefore covers almost the whole gap with cash held flat; the companies can issue less only by spending down their cash.
Cash flow closes most of the gap by 2030
Six hyperscalers, company forecasts, $bn; aggregate cash difference
Two lines from 2026 to 2030 compare the six hyperscalers' cash need with their operating cash flow. The cash-flow line narrows the gap but stays below the cash-need line in 2030, and some companies retain larger deficits. The space between the lines is shaded.
The shaded difference nets company surpluses against deficits and is still $161bn in 2030. Individual 2030 shortfalls total $178bn.
Source: Financial Modeling Prep analyst estimates, Financial Modeling Prep SpaceX statements and analyst estimates, SpaceX June 2026 prospectus - AI segment capital expenditure, FactSet consensus estimates for SpaceX via Finanzen.at · 2026-09-04
How much dollar debt the market must absorb
The six hyperscalers sold $353bn of bonds from January 2025 to 19 August 2026, including $275bn in dollars. Dollar bonds made up 78% of the total, and $113bn had maturities of at least 15 years.
The currency and maturity mix is shifting. Dollar bonds accounted for 74% of issuance in 2026 through August, down from 86% in 2025. The share of dollar issuance with maturities of at least 15 years also declined, from 46% to 39%. Growth in total borrowing nevertheless increased the amount from $43bn to $70bn. Alphabet and Amazon account for all non-dollar issuance in the filing sample.
For bond supply, we retain Goldman's $400bn forecast for the five cloud parents. Including SpaceX's issuer-level estimate brings the six-hyperscaler total to $453bn in 2027. This is our market-supply assumption, not the output of the minimum-funding calculation above. The cash model assumes no buybacks.
Hyperscalers issued $275bn in dollar bonds
Six hyperscalers, January 2025 to 19 August 2026, $bn
Two stacked bars show hyperscaler bond issuance in 2025 and through 19 August 2026. Each bar separates shorter US-dollar bonds, US-dollar bonds of at least fifteen years, and non-dollar bonds.
Long-dollar issuance rose from $43bn in 2025 to $70bn through 19 August. Foreign-currency borrowing taps other markets.
Source: SEC EDGAR pricing term sheets and debt footnotes for AI-buildout bond issuers · 2026-09-04
How the funding mix could change
Using the 2026 currency mix gives $338bn of hyperscaler dollar issuance in 2027. Adding the other American AI issuers we track brings this to $409bn, or 13.6% of a projected $3.02tn dollar corporate bond market.
A dollar share of 70% to 80% gives a range of $317bn to $363bn. If 35% to 40% of those bonds mature in at least 15 years, long-dollar issuance would be $111bn to $145bn, with $130bn in our base case.
Further foreign-currency borrowing is likely as hyperscalers broaden their investor base, consistent with J.P. Morgan's expectation of continued funding diversification. The observed currency mix implies $116bn of non-dollar issuance in 2027. The actual share will depend on borrowing costs after hedging, investor demand and which companies issue the debt.
The 70–80% dollar range is a scenario assumption. Later estimates are funding floors where refinancing schedules are unavailable.
Dollar AI issuance reaches 13.6% of 2027 bond sales
Share of the US dollar corporate bond market, per cent; 2026–27 projected
Grouped bars for 2025, 2026 and 2027 show the rising share of the US dollar corporate bond market supplied by the six hyperscalers and by all tracked American AI issuers.
The 2025 bars use observed issuance. The 2026–27 bars apply the observed currency mix to the debt forecast and divide it by the matching projected dollar bond market.
Source: Goldman Sachs Exchanges - How AI Debt Is Reshaping Credit Markets, SIFMA U.S. Corporate Bonds Statistics, September 2026 update · 2026-09-04
What moved long-term Treasury yields
From 2 January 2025 to 4 September 2026, the 30-year Treasury yield increased from 4.79% to 5.24%, with +48bp coming through real yields and -3bp through inflation compensation. Investors are asking for a higher return after inflation. The inflation measure also contains risk and liquidity effects, which complicates reading it as a forecast of future prices.
The attribution depends on the observation period. Expectations of Fed cuts lowered yields in 2025, a move that reversed in 2026 as the expected rate path increased. Through 2 September, the New York Fed's ACM model attributes +62bp of the year's change in the 10-year yield to expected short-term rates and -3bp to the term premium, the additional return for holding long bonds. This decomposition assigns most of the 2026 rise to Fed expectations.
Starting in January 2025 captures both the fall and recovery in rate expectations, which largely cancels out. Across that period, the ACM and Kim–Wright models show term-premium increases of +25bp and +19bp, ending on 2 September and 28 August respectively. The prospect of more government debt is one reason investors might require this extra compensation.
The 30-year real yield rose +28bp more than the 10-year over the Treasury comparison period, indicating additional pressure at longer maturities. The 10-year models cannot determine how much of this difference reflects deficits or AI borrowing.
Components of the 10-year Treasury yield
Change in the 10-year Treasury yield since 2 January 2025, basis points
Three lines show changes in the 10-year Treasury yield, expected short-term rates and the term premium since January 2025. Expected rates fall during 2025 and recover in 2026. The term premium ends about 19 basis points higher.
Fed Board model. Term premium +19bp by 28 August; expected-rate path unchanged.
Source: Federal Reserve Board, Kim-Wright three-factor term structure estimates (feds200533), data to 28 August 2026 · 2026-09-04
The 30-year yield rise came through real yields
Change since 2 January 2025, basis points
Three lines show changes in the 30-year nominal yield, real yield and inflation compensation over the same observation period.
US Treasury through 4 September 2026. Nominal change is real change plus inflation compensation.
Source: US Treasury - daily Treasury par yield curve rates, US Department of the Treasury - Daily Treasury Par Real Yield Curve Rates · 2026-09-04
The Fed, Treasury and federal borrowing
The Fed has held rates at 3.50–3.75% since December 2025, and inflation is still high enough for officials to discuss an increase. Both Chairman Warsh and Governor Waller said that inflation is the metric that would guide the decision.
The deficit is the longer-term concern. Treasury has kept auction sizes unchanged, bringing projected net issuance excluding bills down from $1,878bn in 2025 to $1,511bn in 2026. Dealers nevertheless expect larger auctions in 2027 because their borrowing forecasts imply a $1.45tn gap over fiscal 2027–28 at current auction sizes and bill supply. Investors can price that expected supply into yields well before the bonds are issued.
The effect on yields depends on how borrowing expectations change. An anticipated deficit can sustain financing pressure without explaining a particular month's sell-off. Revisions to the amount, maturity and timing of issuance are more informative than the deficit total alone.
Treasury Secretary Scott Bessent has responded by expanding buybacks, raising the maximum purchase per operation in the 10–30-year market to at least $4bn from 9 September. Purchases of older bonds can improve liquidity and ease pricing pressure, although financing them through new issuance leaves the deficit's funding requirement unchanged. At this scale, this will have very limited impact on longer-term rates.
Where AI matters
Our six-company sample records $182bn of dollar bonds through 19 August, carrying about the same interest-rate risk as $189bn of 10-year Treasuries, with 61% of that risk in bonds of 15 years and longer. The Dallas Fed's wider estimate is $300bn of investment-grade AI issuance for the full year, or $360bn in 10-year equivalents, about 12% of what Treasury adds in a year. At 1% of GDP, the Fed's rule of 10bp of term premium per 1% of GDP caps AI's effect on the 10-year yield at about 11bp; AI's share of the +19bp Kim-Wright premium rise since January 2025 is 2.4bp.
Corporate bonds and Treasuries have different investor bases, but at the long end they overlap. The extra borrowing has to be absorbed somewhere, and it asks a lot of global savings. Some of that money will move into hyperscaler debt from other assets, including Treasuries.
BNY reports weaker 30-year Treasury auctions since April 2026 and larger yield concessions on some hyperscaler deals, although Treasury demand remains within historical ranges. They do not isolate AI from fiscal expectations, monetary policy or other shifts in demand.
A long AI slowdown, or a ban or moratorium on new data centres, would hurt the hyperscalers badly. Much of the buildout is financed through leases with guaranteed rent, due whether or not the capacity is used; our base case adds $707bn of new lease liabilities by 2030. Weaker cash flow with spending unchanged raises financing needs, so disappointing AI growth would not automatically lower borrowing.
AI could also lead to a fundamental repricing of long-term rates through productivity growth, as more profitable investment increases demand for capital and households expecting higher future incomes bring consumption forward. Uncertainty and precautionary saving could weaken that response. The next part of this series will examine what long-term bond prices imply about transformative AI.
AI borrowing is affecting hyperscaler credit pricing, while its contribution to Treasury yields remains limited. Expected short-term rates explain much of the modelled 2026 rise in the 10-year yield. Federal financing needs remain a longer-term pressure, and slower cash-flow growth could prolong AI borrowing and increase competition for capital.
Sources
- BNY iFlow, Hyperscaler issuance tests long-end UST demand — directional evidence on Treasury holdings, auction demand and hyperscaler new-issue concessions. BNY research using proprietary scored holdings and Bloomberg data
- Breckinridge Capital Advisors, The price of AI: how capex is rewriting tech balance sheets — hyperscaler weight in the Bloomberg US Corporate index. asset-manager research note
- Federal Reserve Bank of Dallas, How AI debt financing impacts duration supply and interest rates — AI-related bond and swap duration supply compared with Treasury issuance. official Federal Reserve Bank research article
- Federal Reserve Board, FEDS Note: Substitutability between balance sheet reductions and policy rate hikes (Crawley, Gagnon, Hebden, Trevino) — the Board's working elasticity of the term premium to duration supply. official research note
- Federal Reserve Board, Tips from TIPS: Update and Discussions — methodology for separating nominal Treasury yields into real-rate and inflation components. official Federal Reserve research note
- Federal Reserve, FOMC statement of 29 July 2026 — the current policy rate and dissents in favour of a hike. official press release
- Five cloud-parent 2027 debt-maturity ledger — aggregate 2027 principal maturities used to bridge net funding need to gross issuance. derived from official SEC filings
- Financial Modeling Prep analyst estimates — consensus EBITDA and revenue with analyst counts for the five cloud parents through 2030. licensed API under subscription
- Financial Modeling Prep quarterly balance-sheet statements — eight-quarter accessible-cash history and pre-2025 opening balances. licensed API under subscription
- Financial Modeling Prep annual cash-flow statements — reported 2025 cash Capex and OCF anchors. licensed API under subscription
- Financial Modeling Prep SpaceX statements and analyst estimates — reported operating cash flow and consensus EBITDA cross-check for SpaceX. licensed API under subscription
- FRED, Gross Domestic Product (GDP), second quarter 2026 — nominal GDP used to scale duration supply. official BEA series accessed through FRED
- Federal Reserve Z.1 nonfinancial corporate debt stock — U.S. nonfinancial corporate debt securities loans and total debt history. official Federal Reserve series accessed through FRED
- Goldman Sachs Exchanges - How AI Debt Is Reshaping Credit Markets — direct parent issuance broader AI debt project finance and market-capacity benchmarks. official Goldman Sachs transcript
- Contemporaneous report of Goldman Sachs five-company Hyperscaler credit research — five-company capex denominators and global IG parent-bond forecasts. public report of Goldman Sachs research
- Chow, Halperin and Mazlish - Transformative AI, existential risk, and real interest rates — consumption-smoothing model linking transformative-AI growth expectations to long-term real interest rates. academic working paper updated June 2026
- IFR, Amazon makes market history with largest corporate bond sale ever (IFR 2624) — size and demand of the March 2026 Amazon bond sale against the 2013 Verizon record. trade press
- J.P. Morgan Asset Management, Hyperscalers: now also a credit story — independent count of 2026 hyperscaler bond issuance and its non-dollar share. public research note
- Microsoft FY2026 financial results — reported cash capex OCF and closing liquid assets. official company release
- Federal Reserve Bank of New York, ACM term premia (Adrian, Crump and Moench), data to 2 September 2026 — decomposition of the 10-year Treasury yield into expected short rates and term premium. official model output, daily spreadsheet
- OECD Global Debt Report 2026 - Corporate debt market outlook — global corporate bond and syndicated-loan issuance and outstanding stock. official OECD report
- Oracle FY2026 financial results — reported cash capex OCF and closing liquid assets. official company release
- PIMCO, AI Financing Needs Do Not Override Cyclical Drivers of Yield — decomposition of a 2026 rise in the 10-year Treasury yield into expected rates and term premium. asset-manager research note citing a Federal Reserve Bank of San Francisco model
- Reuters, AI hyperscalers drive higher US corporate bond issuance forecasts (Matt Tracy) — bank forecasts of 2026 US corporate bond gross and net issuance. wire report, Yahoo Finance syndication
- Sage Advisory, Hyperscaler debt deluge: the new driver of IG spread pressure — count of 2026 deals above USD 20bn and how many came from hyperscalers. asset-manager research note
- SEC EDGAR pricing term sheets and debt footnotes for AI-buildout bond issuers — tranche-level bond issuance with currency and maturity for six hyperscalers and ten other US AI issuers from January 2025 through August 2026. public SEC EDGAR filings (FWP, 8-K, 6-K, 10-Q, 10-K) plus SIX Swiss Exchange and SGX listing reports
- SIFMA U.S. Corporate Bonds Statistics, September 2026 update — US corporate bond issuance through August 2026. official industry-association statistics page
- SpaceX June 2026 prospectus - AI segment capital expenditure — reported SpaceXAI infrastructure spending. official prospectus
- FactSet consensus estimates for SpaceX via Finanzen.at — SpaceX consolidated capex and operating-cash-flow forecasts through 2030. public mirror of consensus estimates
- US Treasury, Treasury Announces Marketable Borrowing Estimates — privately held net marketable borrowing in the second half of 2026. official Treasury borrowing estimate
- US Treasury press release sb0607 - increased sizes of nominal long-end liquidity support buybacks — the 19 August 2026 decision to at least double long-end buyback operation sizes. official press release
- US Department of the Treasury - Daily Treasury Par Real Yield Curve Rates — observed US real interest rate term structure at 5, 7, 10, 20 and 30 years. public dataset
- US Treasury, Minutes of the Treasury Borrowing Advisory Committee meeting on 4 August 2026 — primary-dealer expectations for Treasury coupon issuance in fiscal 2027 and 2028. official Treasury committee minutes
- US Treasury, presentation to the Treasury Borrowing Advisory Committee, August 2026 (fiscal 2026 Q3) — net coupon issuance by quarter and the constant-size projection. official Treasury presentation
- Verizon Communications 2013 Annual Report, Form 10-K Exhibit 13 — the September 2013 USD 49.0bn note issuance. SEC EDGAR filing