
Research · October 9, 2026
What will move markets in Q4 2026
Earnings can carry the S&P 500 through Q4 if AI spending keeps turning into profits, but the index rests on a few AI companies and has little cushion against a ten-year Treasury above 5%. The main risks are Fed tightening in response to supply-driven inflation, the AI labs' revenue and France.

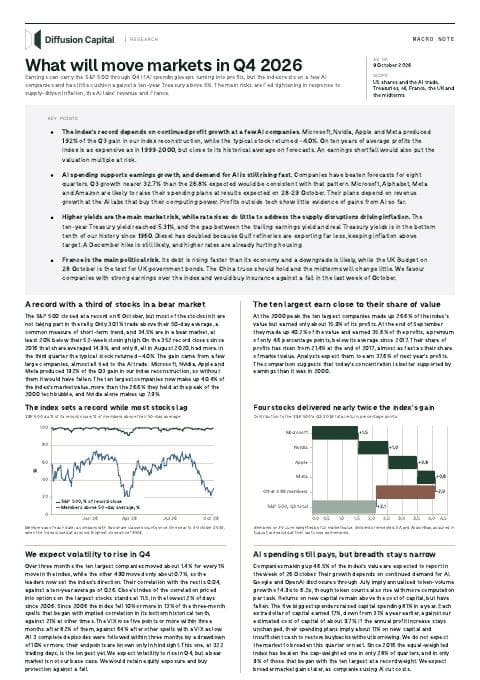
A record with a third of stocks in a bear market
The S&P 500 closed at a record on 6 October, but most of the stocks in it are not taking part in the rally. Only 30.1% trade above their 50-day average, a common measure of short-term trend, and 34.5% are in a bear market, at least 20% below their 52-week closing high. On the 352 record closes since 2016 that share averaged 14.9%, and only 8, all in August 2020, had more. In the third quarter the typical stock returned −4.0%. The gain came from a few large companies, almost all tied to the AI trade: Microsoft, Nvidia, Apple and Meta produced 192% of the Q3 gain in our index reconstruction, so without them it would have fallen. The ten largest companies now make up 40.4% of the index's market value, more than the 26.6% they held at the peak of the 2000 tech bubble, and Nvidia alone makes up 7.9%.
The index sets a record while most stocks lag
S&P 500 as % of its record close; % of members above their 50-day average
Over the past year the S&P 500 stayed within about ten per cent of its record and ended at a record on 6 October, while the share of members above their 50-day average fell from 69 per cent at the August record to 21 per cent on 30 September and stood at 30 per cent on 6 October.
Members as of each date; a company with two share classes counts once. One year to 6 October 2026, when the index closed at a record (highest close since 1950).
Source: Financial Modeling Prep - S&P 500 member daily prices, profiles, statements and consensus, Financial Modeling Prep - daily index, ETF, commodity and FX closes and the US Treasury par curve for the Q4 2026 outlook · 2026-10-09
Four stocks delivered nearly twice the index's gain
Contribution to the S&P 500's Q3 2026 total return, percentage points
Microsoft added 1.5 points, Nvidia 1.0, Apple 0.9 and Meta 0.6, a combined 4.1 points or 192 per cent of the gain, while the other 496 members subtracted 2.0, leaving the index up 2.1 per cent in the third quarter.
Members on 30 June weighted by full market value, dividends reinvested. EA and AvalonBay, acquired in August, are valued at their last close as members.
Source: Financial Modeling Prep - S&P 500 member daily prices, profiles, statements and consensus · 2026-10-09
We expect volatility to rise in Q4
Over three months the ten largest companies moved about 1.4% for every 1% move in the index, while the other 490 moved only about 0.7%, so the leaders now set the index's direction. Their correlation with the rest is 0.04, against a ten-year average of 0.26. Cboe's index of the correlation priced into options on the largest stocks stands at 11.5, in the lowest 2% of days since 2006. Since 2006 the index fell 10% or more in 13% of the three-month spells that began with implied correlation in its bottom historical tenth, against 21% at other times. The VIX rose five points or more within three months after 82% of them, against 64% after other spells with a VIX as low. All 3 completed episodes were followed within three months by a drawdown of 10% or more; their endpoints are known only in hindsight. This one, at 322 trading days, is the longest yet. We expect volatility to rise in Q4, but a bear market is not our base case. We would retain equity exposure and buy protection against a fall.
The ten largest earn close to their share of value
At the 2000 peak the ten largest companies made up 26.6% of the index's value but earned only about 15.9% of its profits. At the end of September they made up 40.2% of the value and earned 35.6% of the profits, a premium of only 4.6 percentage points, below its average since 2017. Their share of profits has risen from 21.4% at the end of 2017, almost as fast as their share of market value. Analysts expect them to earn 37.6% of next year's profits. The comparison suggests that today's concentration is better supported by earnings than it was in 2000.
AI spending still pays, but breadth stays narrow
Companies making up 46.5% of the index's value are expected to report in the week of 26 October. Their growth depends on continued demand for AI. Google and OpenAI disclosures through July imply annualised token-volume growth of 4.9x to 6.2x, though token counts also rise with more computation per task. Returns on new capital remain above the cost of capital, but have fallen. The five biggest spenders raised capital spending 81% in a year. Each extra dollar of capital earned 17%, down from 31% a year earlier, against our estimated cost of capital of about 9.7%. If the annual profit increase stays unchanged, their spending plans imply about 11% on new capital and insufficient cash to restore buybacks without borrowing. We do not expect the market to broaden this quarter or next. Since 2016 the equal-weighted index has beaten the cap-weighted one in only 28% of quarters, and in only 9% of those that began with the ten largest at a record weight. We expect broader market gains later, as companies using AI cut costs.
Valuations are high on past profits but close to average on forecasts
The index trades at 41.6 times its average inflation-adjusted earnings over the past ten years, a level exceeded only in 16 months of the dot-com boom. Its forward valuation is closer to its historical average, at 19.3 times expected earnings, approximately the 71st percentile of months since 1995. Since 1996 the forward P/E has explained almost none of the variation in three-month returns (R² 0.00), while changes in the multiple have accounted for 76% of quarterly swings, against 24% for earnings. This year earnings growth explains much of the index's rise. Earnings rose +25.5% while the multiple moved -9.0%. The ten largest companies trade at 26.8 times trailing earnings, below their decade average of 29.6 times, while the other 490 trade at 22.2 times, above their average of 19.3 times. Yet analysts expect the other 490's profits to grow +20.7% next year against +29.0% for the ten largest.
Ten largest below their average P/E, the rest above
Trailing P/E of the ten largest S&P 500 members and the other 490, month-end
Since 2016 the ten largest companies' trailing P/E has ranged widely and now stands at 26.8, below its 29.6 decade average, while the other 490 trade at 22.2, above their 19.3 average.
Point-in-time members, operating earnings over the last four quarters. Dashed: each group's average, October 2016 to September 2026. Last point 6 October 2026.
Source: Financial Modeling Prep - S&P 500 member daily prices, profiles, statements and consensus, Financial Modeling Prep - per-symbol earnings history and S&P 500 constituents for the Q4 2026 outlook · 2026-10-09
Q2 beats were broad, while 2027 forecasts rely on AI
Q2 earnings grew 33.9% on a year earlier, excluding large one-off gains and charges, against 22.8% expected before companies reported. 86% of companies beat the earnings forecast and 77% the revenue forecast. Outside the 29 AI companies earnings grew 24.2% against 12.9% expected. Analysts raised their Q3 estimates by 1.4% during the quarter, according to FactSet, against an average cut of 2.2% over the past five years. Energy and technology led the estimate increases, while eight of the 11 sectors had their estimates cut. We expect Q3 growth in the middle of the 32.7% to 37.5% range implied by the last eight quarters' earnings surprises, with larger surprises outside AI. Outside AI consensus growth is 17.5% in Q3, 18.7% in Q4 and 12.4% in 2027, so the AI group's share of the expected increase rises from 52% in Q3 to 64% in 2027. Since June, forecasts for 2027 have risen +4.8%, with Nvidia accounting for 47% of the increase, and only +1.5% outside AI and energy. The 2027 forecasts also assume the net margin widens from 15.0% to 17.0% while revenue outside AI grows 4.8%. On the results calls, we will look for capital spending plans for 2027 and evidence that AI is lowering costs at companies outside the AI trade. On the July and August calls 69% of them mentioned AI, but only 11 put a number on what it did for their costs or earnings.
Consensus has growth outside AI slowing in 2027
S&P 500 EPS growth on a year earlier, Q2 2026 reported and today's consensus
Q2 2026 earnings grew 62 per cent for the 29 AI companies, 24 per cent for the rest and 34 per cent for the index. Consensus has the AI group at 52, 49 and 49 per cent for Q3, Q4 and 2027, the rest at 18, 19 and 12 per cent, and the index at 27, 28 and 24 per cent.
AI complex: 29 builders, suppliers and power firms. 6 Oct members and share counts, large one-offs replaced. 2027 is fiscal years. Q4 is partly derived from annual forecasts.
Source: Financial Modeling Prep - per-symbol earnings history and S&P 500 constituents for the Q4 2026 outlook, Financial Modeling Prep - S&P 500 member daily prices, profiles, statements and consensus · 2026-10-09
We expect the S&P 500 to rise about 4% in Q4
Our model puts the S&P 500 at +4.3% above its 6 October close at year-end, mainly from earnings. Forward earnings rose +21.1% over the past two quarters. After two-quarter gains above 8%, the next quarter's median gain was +3.7%, supporting an earnings contribution of +3.5%. From 5.27%, the ten-year yield has been about as likely to rise as fall. Multiple changes contribute little to average returns but 86% of simulated variance, with a 31% loss probability and a one-in-ten outcome of −7.2% or worse. Since 2022, a 25bp yield rise has been associated with a −2.3% multiple change. Our 4.75% yield scenario gives a +8.5% median return; 5.77% gives +0.3%. Across 83 historical forecasts, 83% of returns fell within the 10th–90th percentile range, but direction forecasts did no better than historical frequencies. In 14 periods since 2018 with positioning like today's—trend-followers long, few puts traded, low VIX and expensive single-stock options—the worst subsequent three-month close averaged −7.2%, against −4.6% generally. A 10% earnings shortfall and a multiple one point lower would imply -14.7% for the index.
Earnings add about 3.5% whichever way yields go
Q4 S&P 500 price return by ten-year path; average contribution of each part, %
If the ten-year falls to 4.75 per cent (34 per cent odds), earnings add 2.8 points and the multiple 5.1, for about 8 per cent. If it holds near 5.3 per cent (31 per cent), earnings add 3.5 and the multiple 0.3. If it rises to 5.8 per cent (35 per cent), earnings add 4.1 and the multiple takes away 4.3, leaving the index roughly flat.
Our simulation, 20,000 draws, 6 Oct to 31 Dec. Yield paths and odds from quarters since 1962 that began near 5.3%. Bars are averages; medians in the text run slightly higher.
Source: J.P. Morgan Asset Management - Guide to the Markets U.S. (4Q 2026), Financial Modeling Prep - daily index, ETF, commodity and FX closes and the US Treasury par curve for the Q4 2026 outlook, FRED series in the Q4 2026 outlook snapshot (Federal Reserve Board, BLS, BEA, EIA, ICE and OECD series) · 2026-10-09
Chip designers are priced for less growth than the rest of the AI supply chain
We value the S&P 500's AI suppliers and spenders at an 8.8% discount rate. At that rate, a company with flat profits would trade at about 11.3 times expected earnings. Nvidia, Broadcom, AMD and Marvell trade at 19.8 times, which implies 1.8 years of growth at the 39% a year analysts expect, although their 2028 forecasts have risen +24% since June. At that growth rate, the price implies profits reaching 1.84 times today's expected level, about the same as for the index (1.86 times). Other suppliers are priced for longer periods of growth: chip equipment for 8.3 years, taking earnings to 3.83 times their forward level, networking and optics for 6.2 years, and power and cooling equipment for 6.7 years. Memory and storage makers trade at 6.8 times, below the value of flat profits, so their price assumes earnings fall 40%, which is common near the peak of a memory cycle. With a higher discount rate for the more volatile chip shares, power and cooling equipment is still priced for 4.2 years more growth than the chip designers. We favour the chip designers into the late-October results if the largest AI spenders issue guidance above consensus. Our model links chip earnings forecasts to customer capital spending growth of about +38% in 2027, in line with the consensus of about 38% that Goldman Sachs cited in late September. That consensus was up from 22% in June, while Goldman itself expects 54%.
Implied years of growth along the AI supply chain
Years of growth at consensus pace that today's price implies, 8.8% rate
At an 8.8 per cent discount rate the chip designers' price implies 1.8 years of growth at 39 per cent a year and memory and storage none, against 8.3 years for chip equipment, 6.2 for networking and optics, 6.7 for power and cooling equipment, 3.3 for power producers, 2.6 for servers, 4.9 for the five big spenders, 5.7 for other chips and 5.0 for the other 490.
Consensus net income growing at each group's 2026-29 pace for N years, then flat. Memory trades below the value of flat profits. S&P 500 members; rate: 10y yield + 3.5%.
Source: Financial Modeling Prep - S&P 500 member daily prices, profiles, statements and consensus, Financial Modeling Prep - daily index, ETF, commodity and FX closes and the US Treasury par curve for the Q4 2026 outlook, FRED series in the Q4 2026 outlook snapshot (Federal Reserve Board, BLS, BEA, EIA, ICE and OECD series), Robert Shiller - Irrational Exuberance online data (ie_data.xls) · 2026-10-09
The Fed drives the ten-year; supply drives the thirty-year
The ten-year Treasury yield hit 5.31% on 5 October, its highest since 2002. A Fed staff model attributes +59 bp of this year's +113 bp yield rise to expectations of higher Fed rates. It attributes +51 bp to the term premium, the extra return investors require for holding long bonds.
In our model, no further Fed hike leaves the year-end ten-year yield near 5.01%, and if it hikes twice, near 5.51%, against 5.27% on 6 October. Yields also move about 36bp in a typical quarter on days without scheduled news, so the two outcomes overlap. The thirty-year reacts much less to the Fed and more to bond supply. It ends about +20bp above 6 October in the larger-auction scenario and +19bp higher in the Japanese bond sell-off scenario.
At the ten-year auction on 7 October, a day after the cut-off for our other figures, investors bid 2.77 times the $39bn on offer, the most since January 2016, and dealers had to take only 2.5%, the smallest share in 215 auctions since 2009. At about 5.3% the Treasury can sell its current auction sizes, although strong auctions have in the past lowered yields for only a day.
Treasuries now do less to protect a portfolio of shares. Most of our cases raise yields, and the main exception, a flight to safety if AI spending disappoints, has worked less often since 2022. When shares fell 5% or more, the ten-year yield fell in 72% of cases from 1990 to 2021 but in only 29% since 2022, when equity sell-offs more often coincided with rising yields.
Yields and the S&P 500 in seven Q4 scenarios
Median change from the 6 October close to 31 December
| Odds | 10Y chg | 30Y chg | S&P 500 | |
|---|---|---|---|---|
| No hike | 26% | −26bp | −17bp | +6.2% |
| One hike, steady auctions | 58% | +7bp | +3bp | +3.5% |
| Two hikes | 17% | +24bp | +13bp | +1.8% |
| One hike, larger auctions | – | +22bp | +20bp | +2.3% |
| Flight to safety (AI miss) | – | −17bp | −9bp | −10.0% |
| JGB sell-off (30 Oct BoJ) | – | +18bp | +19bp | +2.7% |
| Brent $130, firm CPI | – | +25bp | +17bp | +1.8% |
The calendar points to a December hike, not an October one
At the 6 October close, Polymarket and Kalshi put the chance of a hike on 28 October at 17% and 18%, respectively. For 9 December, their probabilities were 76% and 72%. September CPI on 14 October is the only major release before the October meeting. Unless it comes in well above forecast, we do not expect the Fed to hike six days before the 3 November midterms, when a hike would look political. By 9 December the Fed will have two more payroll reports and October's inflation figures. In our scenarios, a December hike leaves the ten-year yield +36bp and the thirty-year yield +23bp higher at year-end than a hold would. A 25bp rise in the Fed's median 2027 rate projection adds only +4bp. This year each 10bp rise in the ten-year yield has been associated with an S&P 500 move of about −0.8%. We do not model two term-premium risks: the 3 November midterms, which bear on 2027-28 deficits more than on this quarter's $628bn of borrowing, and changes to Fed Treasury holdings, $4.35tn in the March staff-paper baseline.
Markets moved the next Fed hike to December
Probability of a hike at each FOMC meeting, average of Polymarket and Kalshi, %
The probability of a hike at the 28 October meeting rose from about 25 per cent in August to 69 per cent on 28 September, then fell to 17 per cent by 6 October. Most of the fall came on 29 September, when New York Fed President John Williams said there was no need for urgency; soft PCE and payroll data followed. The probability of a hike on 9 December rose from about 30 per cent to 78 per cent and stood at 74 per cent on 6 October.
New York 16:00 closes, 3 August to 6 October 2026, outcome prices scaled to sum to one. Lines mark speeches by Warsh (Jackson Hole) and Williams, and September payrolls.
Source: Polymarket - Fed Decision in October, December and January (FOMC 28 Oct 2026, 9 Dec 2026, 27 Jan 2027), Kalshi - KXFEDDECISION-26OCT, KXFEDDECISION-26DEC, KXFEDDECISION-27JAN and KXFED-26DEC markets, Federal Reserve Bank of New York - John C. Williams, Unwavering Dedication (remarks at the University at Buffalo, 29 September 2026) · 2026-10-09
Crude is getting through, but diesel is short going into winter
Gulf crude exports have recovered more than shipments of diesel and other refined products. Kpler tracked 10.1 mb/d of crude through the Strait of Hormuz in the week to 6 October, 74% of its pre-war rate, while exports via the Red Sea and Gulf of Oman partly offset the shortfall. Saudi Arabia's East-West pipeline, the largest of them, was hit by drones in September and was back above 80% of capacity by 5 October. Refined products through the strait have fallen to 0.7 mb/d from 3.6 mb/d, because damaged Gulf refineries run well below capacity, and Kpler does not expect them to recover fully before Q2 2027. Refiners elsewhere are paying up for crude to make diesel, so Dated Brent, the price of crude loading within weeks, averaged $114 in September against $101 for futures on 6 October. The G7 agreed on 2 October to release up to 100 mb of emergency stocks over four months, diesel first, but the US Strategic Petroleum Reserve already holds the least crude since 1982.
President Trump has said strikes on Iran could resume after the 3 November midterms if there is no deal, and a third US carrier group is heading to the region. Polymarket gives a US-Iran agreement on the strait by the end of the year a 37% chance. We expect a stalemate through Q4, with Brent near $100, close to futures and below the EIA's $105, set before the G7 release. A deal that lifts the US blockade of Iran's ports would take Brent towards $80, although diesel would stay short until the Gulf refineries are repaired. Renewed strikes would take it towards $130, and Iran's fractured leadership leaves room for factions to attack ships during talks.
US diesel stocks have been below normal since May
US diesel and heating oil stocks, million barrels; shaded: 2021-2025 range
US stocks of diesel and heating oil were near their 2021-2025 average until March, fell below the lowest level of those years for the same week in May and stood at 105 million barrels on 2 October, 11 per cent below average.
EIA data to 2 October 2026. The dotted line is the 2021-2025 average for the same week; on 2 October stocks were 105 mb, 11% below it.
Source: US EIA - Weekly Petroleum Status Report history workbooks (SPR, commercial crude, Cushing, gasoline, distillate, jet fuel stocks; refinery runs, product supplied, crude and distillate trade) · 2026-10-09
Fuel costs have risen alongside freight prices and airfares
New York Harbor diesel doubled from $105 a barrel in February to $210 at the end of September, and US diesel stocks were -11% against their 2021-2025 average on 2 October. Prices have eased a little since the G7 release, and futures price a gradual fall through the winter. We expect the gap between diesel and crude to stay above $70, twice its February level, until Gulf refineries return in spring. Trucking prices rose 2.0% in August, and airfares were 23% higher than a year earlier, consistent with the pattern after past diesel price rises. The Cleveland Fed's nowcast of 0.2% a month for core CPI in September and October suggests limited broader inflation pressure so far. The Fed raised rates by 25bp in September, and the minutes warn that the longer energy prices stay high, the greater the risk that costs spread to other prices. Markets give a December hike about three chances in four, so the risk for shares is that persistent diesel inflation prompts further hikes in 2027. The September and October CPI reports, both out before the 9 December meeting, will show whether other prices are following.
Diesel has risen much further than crude this year
New York Harbor diesel (dark) and Dated Brent (red), US$ per barrel, since 2025
New York Harbor diesel and Dated Brent in US dollars per barrel from January 2025. Through 2025 diesel ran about 25 to 35 dollars above Brent. After the war began in late February 2026 both rose, Brent to 138 dollars in April and diesel to about 190. Brent fell back to the 70s and 80s in June and July while diesel stayed near 160 to 180, so the gap widened. In September Brent rose to 114 dollars and diesel to 210, a gap of 96 dollars on 29 September.
The shaded gap is what diesel costs above crude. It was $96 on 29 September, above 99% of days in 2016-2025, against $34 in February and $117 at the 2022 peak.
Source: FRED series in the Q4 2026 outlook diesel snapshot (EIA and BLS series), FRED series in the Q4 2026 outlook snapshot (Federal Reserve Board, BLS, BEA, EIA, ICE and OECD series) · 2026-10-09
France's debt path is the problem, and the 2027 election is the test
French bonds are falling because France keeps running large deficits, and pensions are part of the reason. French men leave work at 61.9 on average, against 64.7 across the OECD. The 2023 reform that was to raise the pension age to 64 has been paused. The government now expects this year's deficit to reach 5.4% of GDP, more than last year's 5.1% and the 4.6% it first planned. For 2027 it plans a deficit before interest of 2.1% of GDP, which needs €54bn of spending cuts and tax rises that it lacks the votes in parliament to pass. Even if the plan holds, we calculate that France would borrow 1.9 points of GDP more than it can without its debt growing faster than its economy. The calculation uses the low average interest rate on its existing bonds. As old bonds are replaced with new ones at today's ten-year yield, France would need a surplus before interest of 2.4% of GDP.
The ECB can intervene and buy a country's bonds to stop yields rising without good reason, through its Transmission Protection Instrument, but only if the country's debt is sustainable and it follows EU fiscal rules. Scope cut France's rating to A+ on 18 September. The extra yield France pays over Germany closed above 100bp on 24 September for the first time since 2012. Moody's reviews its rating on 23 Oct, and the National Assembly votes on the budget on 17 Nov 2026. Both front-runners in the April 2027 presidential election worry bond investors. Marine Le Pen leads the polls at 35% and wants to return the pension age to 62. Jean-Luc Mélenchon has proposed cancelling the 18% of French debt held by the Banque de France, which EU treaties forbid.
France pays the most over Germany since 2012
French minus German 10-year government yield, daily, basis points
The French spread over Germany rose from about 50 basis points in early 2024 to about 80 after the June 2024 snap election, then from 78 to 115 in September 2026 to 144 on 2 October, the widest since January 2012, before 123 at the 6 October fixing.
Banque de France TEC 10 (11:00 fixing) minus the Bundesbank 10-year. Up 45bp since 31 August after a 144bp peak on 2 October; the daily record is 214bp, November 2011.
Source: Banque de France Webstat - French government bond constant-maturity rate, 10 years (TEC 10), daily, Deutsche Bundesbank - yields derived from the term structure of Federal securities, 10-year residual maturity · 2026-10-09
Healey needs about £12bn to restore his buffer and is likely to find less
Chancellor John Healey has promised to meet the fiscal rules in his first Budget on 28 Oct 2026. The binding rule requires revenue to cover day-to-day spending in 2029-30, and the OBR's March forecast left £23.6bn to spare. Since then the ten-year gilt yield has risen 0.85 percentage points to 5.33%, which on the OBR's rule of thumb adds about £7bn to that year's debt interest. With weaker growth and higher inflation, EY now puts the margin at £11.3bn. Restoring March's buffer would take about £12bn of tax rises or spending cuts, and matching the £29bn average buffer of 2010-2024 about £18bn. That is less than the £26bn raised in November 2025, but income tax, VAT and employee National Insurance, about 70% of tax revenue, are ruled out. The Treasury has sounded out investors on a buffer of £15-20bn. We expect it to aim for the low end, which needs about £4bn. A thin buffer would leave gilts exposed to the next rise in yields: the thirty-year reached 6.04% on 7 October, the highest since 1998, and markets price a Bank of England hike on 5 Nov at about 80%.
Healey must find £4-18bn, depending on his buffer
Tax rises or spending cuts needed in 2029-30 for each buffer, £bn
Starting from EY's estimate of £11.3bn of headroom, a £15bn buffer would need £3.7bn of tax rises or cuts, a £20bn buffer £8.7bn, restoring March's £23.6bn £12.3bn, and matching the £29bn average of 2010-2024 £17.7bn.
Need = buffer minus EY's £11.3bn headroom estimate (5 Oct); dark bar is our view. The OBR left £23.6bn in March; higher gilt yields have since cost about £7bn of it.
Source: EY - UK Pre-Budget Fiscal Outlook October 2026, Bloomberg via Yahoo Finance - Healey considers smaller Budget headroom, Office for Budget Responsibility - Economic and fiscal outlook March 2026, Office for Budget Responsibility - March 2026 detailed forecast tables: debt interest ready reckoner, Bank of England - ten-year nominal par yield on British government stock (IUDMNPY), Resolution Foundation - New Chancellor faces £10 billion headroom headache · 2026-10-09
The midterms matter more for 2027 than for Q4
Prediction markets favour Democrats winning both chambers of Congress on 3 November. We find no statistically clear relationship between changes in those odds and asset prices so far. Republicans hold 53 Senate seats, so Democrats need a net gain of four. Polymarket gives them a 65% chance of winning the Senate, up from 25% in August 2025, and 91% for the House. The cost of living dominates the campaign, and in a KFF poll 60% of voters said they worry about gasoline and transport costs, tied with health costs as their top concern. About seven Senate races are close enough to decide control, among them Ohio, Maine, Texas, Iowa and Alaska. Alaska and Maine count voters' second choices when no candidate wins a majority, which takes time, so control may not be known for a week or more after the vote.
In weekly data since August 2025, none of fifteen sector and style funds has a statistically significant relationship with the Senate odds. The strongest link has a t-statistic of 1.5, below the conventional threshold of about 2. The ten-year yield has moved +3bp for each 10-point rise in the odds, also not statistically distinguishable from zero. Election results have moved markets little in the past, because investors usually price the likely winner before the vote. On the day after a midterm the index has moved 1.03% on average, against 0.67% on an ordinary day. Strong fourth quarters in midterm years are a weak guide too. Since 1950 the fourth quarter of a midterm year has returned +6.6% against +3.4% in other years. Since 1999 that lead has reversed to -1.1 pp, and it usually followed a weak summer, while this year the index returned +17.2% from April to September.
A Democratic House would mean divided government, preventing either party from passing a tax and spending bill alone in 2027 and 2028. Raising the debt limit, reached again in 2027, would require agreement between the parties. Before the new Congress sits in January, the outgoing Republican majority is likely to try to pass a budget bill that needs only a simple majority in the Senate, with $350bn for defence, in the same weeks as the 11 December funding deadline. The election does not itself remove tariffs imposed under existing trade laws. For the AI trade, Morgan Stanley's policy team argued on 7 October that the vote matters through local resistance to new data centres more than through federal AI rules. It sees a Republican sweep as the best outcome for investor confidence in AI construction and a Democratic sweep as the worst. The decisions that actually delay projects, such as grid connections, power prices for large users, zoning and water permits, are taken by states, utility commissions and local governments.
Markets expect a Democratic House; the Senate is open
Polymarket odds of the four House and Senate outcomes, %, normalised to 100
Over the past year the odds of Democrats winning both chambers rose from about 20 per cent to 64 per cent, mostly at the expense of a Democratic House with a Republican Senate, now 26 per cent.
A sweep is priced at 64%, above the 59% implied if the two chambers were independent, so markets expect one national swing to decide both. Kalshi: House 91%, Senate 63% D.
Source: Polymarket - Balance of Power: 2026 Midterms, Kalshi - CONTROLH-2026 and CONTROLS-2026 markets · 2026-10-09
The midterm autumn lead rests on a few strong years
Average S&P 500 price return, %, by month and year of the presidential cycle
A grid of average monthly S&P 500 returns for the four years of the presidential cycle. Midterm-year October and November stand out at about three per cent each, after a weak midterm summer.
1950-2025, 18 to 19 years per cell. Midterm Octobers average +3.0% against +0.9% in all years, but dropping 1998 alone cuts the midterm Q4 lead by a quarter.
Source: Financial Modeling Prep - daily index, ETF, commodity and FX closes and the US Treasury par curve for the Q4 2026 outlook · 2026-10-09
AI spending plans should rise again, and the AI labs' revenue is the main risk
Microsoft, Alphabet, Meta and Amazon are likely to raise their spending plans at results expected on 28-29 October, because demand for computing power still runs ahead of supply. One-year rental prices for Nvidia's H100 chips rose about 40% between October and March, and OpenAI's API traffic grew 2.5 times in the five months to April. Consensus cited by Goldman Sachs puts 2027 spending growth for those four companies plus Oracle at about 38%. SemiAnalysis expects OpenAI and Anthropic to use 40-50% of new computing power in 2027, making their revenue growth a risk to these plans. AI shares fell after the Financial Times reported OpenAI's September annualised revenue at about $50bn on 8 October; differing treatment of cloud-partner sales complicates comparisons. TSMC's results on 15 Oct and Anthropic's reported November listing, raising up to $100bn at a valuation of up to $2tn, are the other tests. Post-results index moves have averaged 0.95% since 2023. The VIX at 15.0 measures 30-day volatility; late-October protection needs to be assessed at the relevant option prices.
World AI token use rose about 25-fold in five quarters
Tokens processed worldwide, trillions a day, quarterly average
Exponential View's estimate of world AI token use rose from about 34 trillion tokens a day in the first quarter of 2025 to about 880 trillion in the second quarter of 2026, with API traffic about two fifths of the total.
Exponential View estimate for all major providers including China, read from its June 2026 chart; June 2026 was its estimate. Subscription and internal use include chat apps.
Source: Exponential View (Azhar et al.) - The State of the AI Economy, June 2026 · 2026-10-09
Q3 results are unlikely to show AI spreading beyond tech
Profits outside tech show little evidence of gains from AI yet. Most of the 26.8% consensus Q3 earnings growth comes from chips, oil and a few tech firms, while FactSet expects financials to grow 3.0%. The banks report on 13-14 Oct. Quantified savings remain sparse outside tech, but the transcript sample includes non-bank companies too. Until those savings show in costs, the index stays dependent on a few AI companies.
Higher rates are hurting housing and borrowers, not the AI build-out
The largest AI spenders have continued borrowing despite higher Treasury yields. The 30-year mortgage rate reached 7.28% on 1 October, from 6.15% at the end of 2025, adding about $300 a month on a $400,000 loan. S&P 500 homebuilders are -12.0% this year against +14.2% for the index. A high-yield spread above 4%, against 3.12% now, would suggest private-credit strains are spreading to public markets.
Inflation should stay above target, and the Fed is likely to hike in December anyway
Higher rates cannot repair the energy supply disruptions contributing to inflation. We nevertheless expect the Fed to consider a December hike to limit their effect on other prices. Consumer prices rose 3.4% in the year to August, driven by energy and the war, while core prices rose 2.4%. Goldman Sachs estimated in July that AI's contribution to core PCE inflation would rise from 0.2 to 0.5 points by year-end. Warsh said in September that the Fed cannot affect any individual price and can only stop rises from spreading, so its hikes work mainly by cooling demand. September CPI on 14 October and core PCE on 29 October are the dates to watch, and markets give a December hike 76%. Long yields are unlikely to fall while governments across rich countries borrow more. The US term premium has moved +51 bp this year. The thirty-year gilt yield reached 6.04% and Japan's thirty-year yield hit a record. Markets assign a about one in four chance to a Bank of Japan hike on 29-30 October, leaving scope for a surprise.
Headline inflation has pulled away from core
US consumer prices, % change on a year earlier, monthly
Headline CPI inflation fell from about 9 per cent in 2022 to near 3 per cent in 2024-25, then rose to 3.4 per cent in August 2026 as energy prices jumped, while core inflation eased to 2.4 per cent.
BLS CPI via FRED, to August 2026. Core leaves out food and energy; the gap since March is mostly energy and the war. Dashed: 2% reference; the Fed targets PCE, not CPI.
Source: FRED series in the Q4 2026 outlook snapshot (Federal Reserve Board, BLS, BEA, EIA, ICE and OECD series), Bureau of Labor Statistics, Consumer Price Index for August 2026 · 2026-10-09
France faces a downgrade, the China truce should hold and the midterms will change little
France should get through the quarter with a downgrade but no crisis. We think a Moody's cut on 23 Oct is more likely than not, and a failed budget vote on 17 Nov 2026 would leave the option of a special funding law. The gap over German yields, 123bp now, should stay between about 120 and 150bp. A censure motion that brings down the government would push it above 150bp and the euro lower. The China truce looks set to be extended. Watch the tariff exclusions expiring on 9-10 November and the expected Trump-Xi meeting in Shenzhen on 18-19 Nov. High inflation gives the US an incentive to avoid a renewed trade war. Democrats are likely to win the House, priced at 91%, while the Senate is closer at 65%, but past midterms moved the index only 1.03% the next day. The bigger risk is a lame-duck budget bill with $350bn for defence before the 11 December funding deadline, which would push long yields up. A short funding extension, with no shutdown, is the more likely outcome.
Q4 2026: the risk bunches in the last week of October
Events and reported plans, 13 October 2026 to 10 January 2027
A timeline of 26 events and reported plans. Late October includes peak earnings, the Fed, UK Budget, GDP, core PCE, ECB and Bank of Japan. The Anthropic bar covers November before Thanksgiving, not a confirmed listing date.
Dates: BLS, BEA, central banks, HMT, Treasury and USTR. Company results dates estimated except TSMC; IPO month reported, not confirmed. Tariff expiries are as written.
Source: Financial Modeling Prep - economic calendar 2015-2026, Financial Modeling Prep - per-symbol earnings history and S&P 500 constituents for the Q4 2026 outlook, HM Treasury - Chancellor letter to the Treasury Select Committee on the Budget 2026 date, USTR - Notice of product exclusion extensions (FR Doc 2025-21671), NACo - Congress passes short-term funding bill through Dec. 11, Bloomberg - US and China to extend trade truce to Jan. 10 Bessent says, TSMC - Quarterly results, Reuters via Yahoo Finance - Moody's sees no quick resolution of France's political difficulties, Bank of England - MPC dates for 2026, European Central Bank - Schedules for the meetings of the Governing Council, Financial News (Korea) - APEC Leaders' Meeting in Shenzhen, Yahoo Finance - Anthropic targets pre-Thanksgiving IPO at $2 trillion valuation · 2026-10-09
Sources
- Assemblée nationale - Conférence des présidents relevé de conclusions 15 July 2026 — the parliamentary calendar for the 2027 budget and social-security budget. official parliamentary record
- Axios - Military ordered to be ready for possible Iran strikes as Trump weighs timing — US military preparation for renewed strikes on Iran around the midterms. news report
- BBH - How might the 2026 US midterms influence financial markets — lame-duck reconciliation and fiscal scenarios. bank research note
- Banque de France Webstat - French government bond constant-maturity rate, 10 years (TEC 10), daily — the daily French ten-year government yield and its spread over Germany. public API with free client id
- Bloomberg - US and China to extend trade truce to Jan. 10 Bessent says — US-China truce expiry. news report
- Business Insider Japan - Goldman Sachs on AI and US inflation — AI build-out contribution to core PCE. news report of bank research
- Bloomberg via Yahoo Finance - Healey considers smaller Budget headroom — the UK fiscal headroom before the 28 October Budget. news report
- Bloomberg Tax - Reeves builds bigger fiscal buffer in UK Budget — the November 2025 UK Budget. news report
- Bureau of Labor Statistics, Consumer Price Index for August 2026 — Latest published CPI inflation. official US statistical release
- Bureau of Labor Statistics, Consumer Price Index news release archive — Publication dates of the monthly CPI release. official release archive
- Bureau of Labor Statistics - 2025 lapse in appropriations: impact on the Consumer Price Index — why October 2025 CPI is missing and how rents were carried forward. official webpage
- Bureau of Labor Statistics, Employment Situation news release archive — Publication dates of the monthly jobs report. official release archive
- Bureau of Labor Statistics, Producer Price Index for August 2026 — producer prices for truck transportation of freight. official US statistical release
- Bank of England - ten-year nominal par yield on British government stock (IUDMNPY) — the UK ten-year gilt yield, daily. public dataset
- Bank of England - MPC dates for 2026 — Bank of England decision dates in Q4 2026. official calendar
- Bank of Japan - release schedule — the October 2026 Monetary Policy Meeting and Outlook Report dates. official central-bank publication
- Boursorama/AFP - Budget: Lecornu tend la main aux socialistes tentés par la censure — the Socialists' response to the budget. news report
- Bipartisan Policy Center - When will we reach the debt limit again? — timing of the next debt-limit deadline. think-tank analysis
- Deutsche Bundesbank - yields derived from the term structure of Federal securities, 10-year residual maturity — the German ten-year government yield, daily. public REST API
- Cboe Global Markets - daily put and call volume and put/call ratios (total, equity, index, SPX+SPXW, VIX) — options positioning (put/call volume) for the Q4 2026 outlook. public exchange data download
- Cboe VIX methodology — VIX horizon and option-pricing interpretation. official methodology
- Federal Reserve Bank of Cleveland - Inflation Nowcasting — nowcast of September and October 2026 CPI. public webpage
- AMZN earnings call 2026-07-30 — company guidance and earnings evidence. licensed_full_body_selected_prepared_remarks_and_QA_read
- ORCL earnings call 2026-09-10 — company guidance and earnings evidence. licensed_full_body_selected_prepared_remarks_and_QA_read
- CNBC - U.S. to send third carrier group to Mideast as Trump warns of new Iran strikes — US statements on resuming strikes on Iran after the midterms. news report
- Dwarkesh Podcast - Dylan Patel (SemiAnalysis) on AI compute — the AI labs' share of new compute in 2027-28. podcast transcript
- European Central Bank - long-term interest rates for convergence purposes (IRS), ten-year government bond yields — monthly French, German, Italian, Spanish and Dutch ten-year yields since 1993. public REST API
- European Central Bank - Schedules for the meetings of the Governing Council — ECB monetary policy meeting dates in Q4 2026. official calendar
- ECB - The Transmission Protection Instrument — Conditions for countering unwarranted sovereign yield rises. official policy statement
- EIA Short-Term Energy Outlook - October 2026 — Brent and diesel price forecasts for Q4 2026. official forecast (PDF)
- US EIA - Weekly Petroleum Status Report history workbooks (SPR, commercial crude, Cushing, gasoline, distillate, jet fuel stocks; refinery runs, product supplied, crude and distillate trade) — US crude and product stocks against the 2021-2025 range and the SPR drawdown since the Iran war. public download (https://www.eia.gov/dnav/pet/hist_xls/<series>w.xls; no key)
- Epoch AI AI-companies revenue and usage reports (7 Oct 2026 snapshot) — AI lab revenue run rates and company token counts for the Q4 2026 outlook. bulk-download
- Euronews - Sébastien Lecornu propose un effort budgétaire de 54 milliards d'euros — the 2027 savings plan and the government's position. news report
- Exponential View (Azhar et al.) - The State of the AI Economy, June 2026 — global AI token volumes by month. research report (PDF)
- Exponential View - Data to start your week: the AI capacity trap — growth in AI token demand. research newsletter
- EY - UK Pre-Budget Fiscal Outlook October 2026 — UK fiscal headroom before the 28 October Budget. research report (PDF)
- FactSet Earnings Insight - 2 October 2026 (John Butters) — reported Q3 2026 expected S&P 500 earnings growth and in-quarter estimate revisions. public PDF
- Anderson et al. - A User's Guide to Reducing the Federal Reserve's Balance Sheet (FEDS 2026-019) — policy option estimates and dated balance sheet; notebook 49. full public PDF; numerical tables visually verified
- Federal Reserve Board, FEDS Note: Substitutability between balance sheet reductions and policy rate hikes (Crawley, Gagnon, Hebden, Trevino) — the Board's working elasticity of the term premium to duration supply. official research note
- Federal Reserve, FOMC meeting calendars and statements — Dates of FOMC policy statements. official calendar
- Federal Reserve - Inflation (PCE) — PCE rather than CPI inflation target. official policy explanation
- Federal Reserve - Transcript of Chair Warsh's press conference 16 September 2026 — the Fed's view of supply-driven inflation. official transcript
- Federal Reserve, Summary of Economic Projections, 16 September 2026 — FOMC rate inflation and unemployment projections. official projection table
- Financial Modeling Prep - historical analyst estimates archived by Diffusion Capital — dated EPS revenue and EBIT forecasts and split-adjusted prices. licensed warehouse export
- Frozen FMP company financials transcripts and extracted guidance — read-only research export for earnings concentration. licensed local warehouse export
- Financial Modeling Prep - S&P 500 member daily prices, profiles, statements and consensus — market breadth and equity-implied AI diffusion. licensed API under subscription
- Financial Modeling Prep - daily index, ETF, commodity and FX closes and the US Treasury par curve for the Q4 2026 outlook — S&P 500 since 1950, VIX, sector and style ETFs, Brent and WTI front-month futures, European indices, EUR/USD and Treasury bill and note yields. licensed API under subscription
- Financial Modeling Prep - earnings-call transcripts for every S&P 500 member for the Q4 2026 outlook — count of S&P 500 calls citing AI and of companies quantifying AI cost or earnings effects. licensed API under subscription
- Financial Modeling Prep - economic calendar 2015-2026 — release dates, consensus estimates and outcomes for US and European data and central-bank decisions. licensed API under subscription
- Financial Modeling Prep - quarterly cash-flow statements for every S&P 500 member since 2016 — common stock repurchased, issuance, dividends and net income per fiscal quarter, up to 48 quarters. licensed API under subscription
- Financial Modeling Prep - per-symbol earnings history and S&P 500 constituents for the Q4 2026 outlook — final pre-report EPS consensus and reported EPS for the last sixteen quarters of every current member, and Q3 2026 report dates. licensed API under subscription
- Financial News (Korea) - APEC Leaders' Meeting in Shenzhen — the APEC summit and a Trump-Xi meeting. news report
- Federal Reserve - Minutes of the FOMC meeting of 15-16 September 2026 — Fed officials' view of energy pass-through. official minutes
- France 24 - Poll shows French far-right leader Marine Le Pen widening lead ahead of 2027 presidential vote — 2027 French presidential polling. news report
- French Ministry of Economy - Budget 2026 special law — Essential funding if a full budget is not adopted. official government explanation
- FRED - Market Yield on U.S. Treasury Securities at 10-Year Constant Maturity — the observed ten-year Treasury yield during the Federal Reserve purchase programmes. official Federal Reserve Board H.15 series distributed by FRED
- FRED FEDTARMDLR - FOMC Summary of Economic Projections median longer-run federal funds rate — The Fed's own read of the nominal neutral policy rate since 2012. public data series
- Investing.com (FT report) - OpenAI annualized revenue at $50bn far below reports — OpenAI's revenue run-rate. news report
- Goldman Sachs (via Yahoo Finance) - consensus 2027 hyperscaler capex estimates are too conservative — reported consensus and Goldman estimates of 2027 hyperscaler capital spending and the share of companies quantifying AI earnings effects. public article
- Goldman Sachs (via PYMNTS / Bloomberg) - hyperscaler AI capex to reach $1.2 trillion in 2027 — latest reported consensus and Goldman estimates of 2027 capital spending for the five largest US hyperscalers. public report of Goldman Sachs research
- Alphabet Q2 2026 earnings call — company guidance and earnings evidence. issuer_transcript_prepared_and_qa
- Google I/O 2026 keynote — current monthly token processing disclosure. official company disclosure
- Alphabet Q2 2026 CEO remarks — Google first-party model API token throughput. official company disclosure
- gov.uk - Ministerial appointments July 2026 and Prime Minister page — the new UK Prime Minister and Chancellor. official government publication
- Haut Conseil des finances publiques - Avis n° HCFP-2026-5 sur les PLF et PLFSS 2027 — official assessment of France's 2027 budget forecasts. official assessment (PDF)
- HM Treasury - Chancellor letter to the Treasury Select Committee on the Budget 2026 date — the date of the UK Autumn Budget. official government publication
- IEA - Statement by the Executive Director on the meeting of IEA Member governments on 7 October 2026 — how much of the March release is out and what public stocks remain. official public statement
- ING via Hellenic Shipping News - France's elusive €54bn fiscal fix — France's 2026 deficit and 2027 budget plan. research note (republished)
- ING Think - The Commodities Feed: middle distillate cracks under pressure amid diesel release — diesel cracks after the G7 release and the East-West pipeline. bank research note
- Inside Defense - OMB director confident lame-duck Congress will meet defense reconciliation request — lame-duck defence reconciliation plans. news report
- investingLive - BoJ's Ueda in focus as markets weigh a back-to-back October rate hike — market odds of a Bank of Japan hike in October. market news
- J.P. Morgan Asset Management - Guide to the Markets U.S. (4Q 2026) — dot-com-peak top-10 market cap and earnings share, and the S&P 500 forward P/E history. public PDF
- Meera Pandit and Corey Hill - J.P. Morgan Asset Management: How extreme is market concentration? — stated top-10 market-cap share at the tech bubble peak. public webpage
- Kalshi - CONTROLH-2026 and CONTROLS-2026 markets — market-implied odds of House and Senate control. public API (markets and daily candlesticks)
- Kalshi - KXFEDDECISION-26OCT, KXFEDDECISION-26DEC, KXFEDDECISION-27JAN and KXFED-26DEC markets — prediction-market odds of Fed rate decisions and of the funds-rate level after December. public API (trade-api v2 markets and hourly candlesticks)
- KFF - Health Tracking Poll: health care issues in the lead-up to the 2026 midterm election — voters' top cost concerns before the midterms. survey
- IBTimes UK - Strait of Hormuz crude returns to prewar levels, diesel supplies tight (Kpler), 1 October 2026 — crude through the strait at its peak and the shortfall in refined products. news report quoting Kpler
- Paul Krugman - What's the Matter With France? — argument that France's fiscal problem is structural and pension-driven. commentary (Substack)
- La Libre/AFP - 140 milliards d'économies: ce qu'il faut retenir de l'intervention de Marine Le Pen — National Rally fiscal and pension pledges. news report
- Meta Q2 2026 results — company guidance and earnings evidence. issuer_release
- Morgan Stanley - Thoughts on the Market: what the midterms could mean for the AI investment cycle (Ariana Salvatore, 7 October 2026) — how midterm outcomes bear on AI infrastructure sentiment. podcast transcript
- Microsoft FY2026 Q4 earnings call — company guidance and earnings evidence. issuer_transcript_prepared_and_qa
- NACo - Congress passes short-term funding bill through Dec. 11 — US government funding deadline. public webpage
- Federal Reserve Bank of New York - John C. Williams, Unwavering Dedication (remarks at the University at Buffalo, 29 September 2026) — New York Fed president signalling no urgency for an October hike. public webpage
- Office for Budget Responsibility - March 2026 detailed forecast tables: debt interest ready reckoner — sensitivity of UK debt interest to gilt yields. official dataset (XLSX)
- Office for Budget Responsibility - Economic and fiscal outlook March 2026 — UK fiscal forecast and the 2029-30 current-budget surplus. official report (PDF)
- OECD - Pensions at a Glance 2025 — effective labour-market exit ages. official report (PDF)
- OpenAI - the next phase of enterprise AI — OpenAI API token throughput. official company disclosure
- Ministère de l'Économie et des Finances - Projet de loi de finances pour 2027 — France's 2026 and 2027 deficit, debt, consolidation and state financing plan. official government publication
- Polymarket - Balance of Power: 2026 Midterms — market-implied odds of the four House-Senate control outcomes. public API (gamma and CLOB price history)
- Polymarket - Fed Decision in October, December and January (FOMC 28 Oct 2026, 9 Dec 2026, 27 Jan 2027) — prediction-market odds of Fed rate decisions and their path since August. public API (gamma-api.polymarket.com events; clob.polymarket.com prices-history)
- Polymarket - Iran markets — market odds of a US-Iran agreement on the Strait of Hormuz. public webpage
- Resolution Foundation - New Chancellor faces £10 billion headroom headache — UK fiscal headroom and historical buffers. think-tank press release
- Reuters via Yahoo Finance - UK 30-year gilt yields hit highest since 1998 — gilt yields on 7 October 2026. news report
- Reuters (via The National) - Hormuz traffic hits lowest level in two months as tanker attacks surge, 8 October 2026 — Kpler's weekly crude-through-Hormuz volume and bypass exports. news report quoting Kpler and LSEG
- Reuters via The Star - Hard-left presidential candidate's plan to cancel French debt sparks backlash — France's 2027 presidential election and fiscal risk. news report
- Reuters via Yahoo Finance - Moody's sees no quick resolution of France's political difficulties — Moody's review date and assessment of France. news report
- Newsquawk - Scope downgrades France's long-term ratings to A+ — France's sovereign rating. news headline
- SEC EDGAR Company Facts API - Microsoft Alphabet Amazon Meta Oracle (7 Oct 2026) — operating income tax pretax income and balance-sheet items for return on invested capital. public API
- SEC EDGAR pricing term sheets and debt footnotes for AI-buildout bond issuers — tranche-level bond issuance with currency and maturity for six hyperscalers and ten other US AI issuers from January 2025 through August 2026. public SEC EDGAR filings (FWP, 8-K, 6-K, 10-Q, 10-K) plus SIX Swiss Exchange and SGX listing reports
- SEC EDGAR Company Facts API - six AI infrastructure builders — quarterly operating cash flow cash capex leases debt and equity. public API
- Seoul Economic Daily - Anthropic eyes November IPO at up to $2 trillion valuation — Anthropic's reported IPO plans. news report
- SemiAnalysis - The great GPU shortage: rental capacity — H100 rental contract prices. industry research newsletter
- US Senate - Party Division — Senate majority after each midterm since 1950 and current 53-45-2 split. official public web
- Robert Shiller - Irrational Exuberance online data (ie_data.xls) — monthly S&P 500 price, earnings, dividends, CPI and 10-year yield since 1871. public spreadsheet
- Trading Economics - UK 10-year gilt yield news — market pricing of a November Bank of England hike. market news
- US Treasury Fiscal Data - Treasury Securities Auctions Data (auctions_query) — coupon auction sizes, high yields, bid-to-cover and awards to indirect bidders, direct bidders and primary dealers. public JSON API
- US Treasury, Treasury Announces Marketable Borrowing Estimates — privately held net marketable borrowing in the second half of 2026. official Treasury borrowing estimate
- US Treasury, quarterly refunding statement of 5 August 2026 — auction-size guidance and buyback sizes. official press release
- US Treasury, Minutes of the Treasury Borrowing Advisory Committee meeting on 4 August 2026 — primary-dealer expectations for Treasury coupon issuance in fiscal 2027 and 2028. official Treasury committee minutes
- Trustnet - Chancellor Healey commits to fiscal rules as spending pledges mount ahead of Budget — Healey's commitment to the fiscal rules and the March headroom. news report
- TSMC - Quarterly results — TSMC third-quarter 2026 results date. company investor relations
- USTR - Notice of product exclusion extensions (FR Doc 2025-21671) — Section 301 exclusion expiry. Federal Register
- Wells Fargo - Wells Fargo to announce third quarter 2026 earnings on 13 October — Q3 2026 bank reporting dates. company announcement
- World Oil - IEA to discuss 100 MMbbl emergency oil and diesel stock release — the G7 call for a further diesel-first stock release. public news article
- Yahoo Finance - Anthropic targets pre-Thanksgiving IPO at $2 trillion valuation — Anthropic's reported IPO plans. news report
- Yahoo Finance/Investing.com - AI to hit US inflation (CIBC) — AI build-out contribution to US inflation. news report of bank research